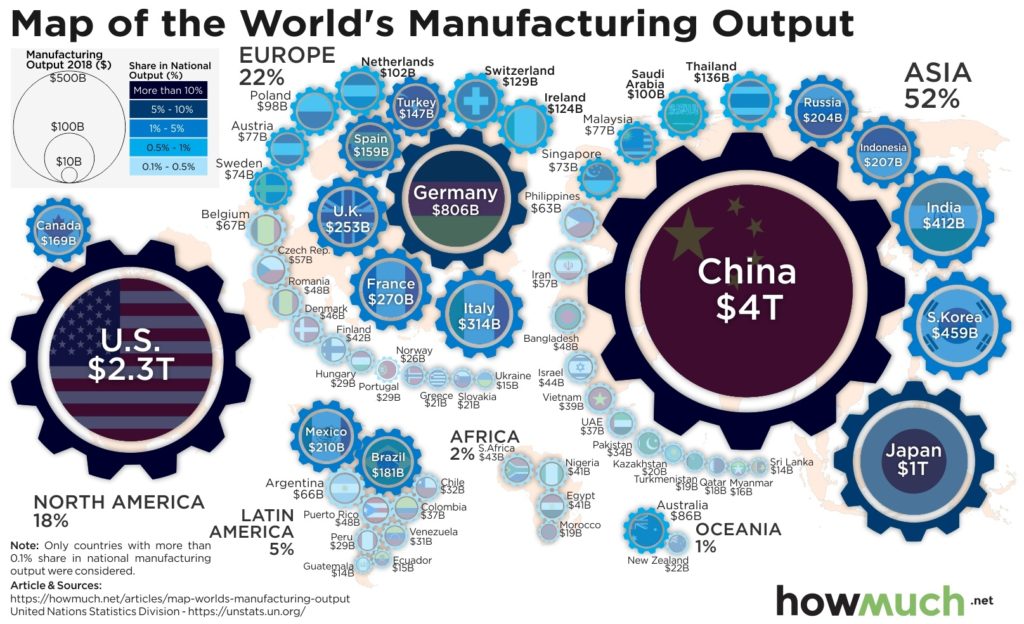
Ever wonder about economic output by a particular country? How about economic output per person of a particular country? We came across an infographic that tally’s 2018 gross domestic product (in this case, GDP manufacturing) by country and incorporates it into a map with bubbles indicating the size of GDP manufacturing by country.
Coventry League also advanced this analysis a step further by combining the data with 2019 population figures and then revealed the output on a per capita basis. You might be surprised by the findings.
Contents
GDP Manufacturing Map
Below is the bubble map of gross domestic product (just manufacturing) in U.S. current dollars (2018). The infographic is provided by HowMuch.net, a financial literacy website.1Click image to enlarge.
China, of course, dominates in terms of absolute dollar amount of GDP Manufacturing. However, the U.S. is in a solid #2 place, well ahead of the remaining pack.
Top 10 Countries with Largest Manufacturing Industries:
- China: $4T (28.37% of world total)
- United States $2.3T (16.65%)
- Japan: $1T (7.23%)
- Germany: $806B (5.78%)
- South Korea: $459B (3.29%)
- India: $412B (2.94%)
- Italy: $314B (2.24%)
- France: $270B (1.93%)
- UK: $253B (1.8%)
- Mexico: $210B (1.5%)
Nevertheless, let’s take a look at these figures more granularly, especially with respect to per capita output for both GDP Manufacturing and GDP Total.
GDP Manufacturing Table
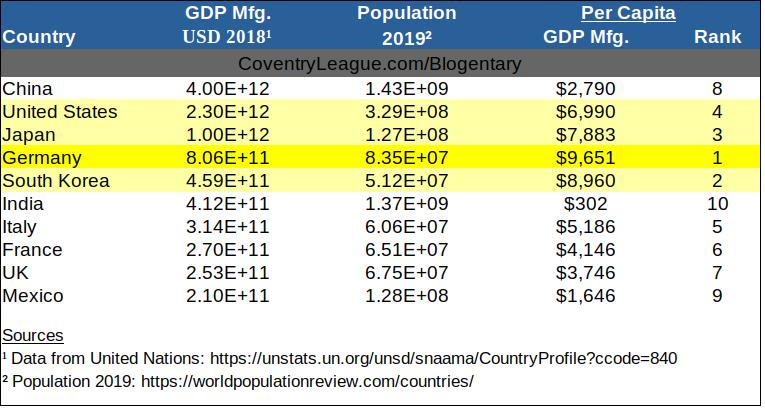
Here is a table of the top ten countries with respect to manufacturing industries (GDP Manufacturing). The data is from the same source, the United Nations. We also include population data from 2019 to arrive at approximate per capita amounts.
So, what does this table reveal? Well, a few things. First, Germany–highlighted in yellow–is ultra efficient when one considers its total manufacturing output of ~$806 billion and per capita amount of $9,652. South Korea is very close to Germany on a per capita basis, but its total GDP Manufacturing is only about 50% of Germany’s. The U.S., however, is really a powerhouse. For example, even though its total manufacturing output is only about 60% of #1 China’s, the U.S.’s per capita output is 250% greater than China’s.
Moreover, if all countries had to meet an acceptable world-wide standard with respect to pollution, safety, quality, and employee well-being, then China would certainly drop from the top ranking, and probably well out of the Top 10 ranking.
Now, let’s take a look at GDP Total for the same ten countries.
GDP Total by Selected Country
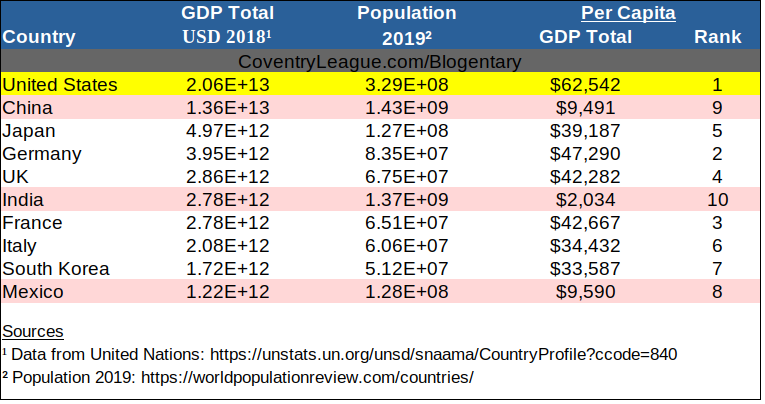
This GDP Total table reveals that the U.S. is actually quite dominant with total output at about $20.6 trillion, more than 50% greater than China’s. China has been closing the gap quite quickly though.
What’s more noticeable is the U.S. is an outlier to the remaining nine countries in this list when per capita is considered. The U.S.’s per capita figure of $62,542 is more than 30% greater than Germany’s, which is #2.
Also, the table highlights in light red several countries in which GDP Total per capita is in the low double digits ($10-20-ish thousand, or below), or even less. This category essentially represents countries throughout the world including most of Africa, South America, etc.
The countries not highlighted have per capita mostly in the $30-$40-ish thousand and represent most Western countries and some oil-rich Middle Eastern countries (Qatar, for example).
So, this begs the question: What are some countries or places that have per capita GDP greater than that of the U.S.’s?
GDP Per Capita Table: Top 5
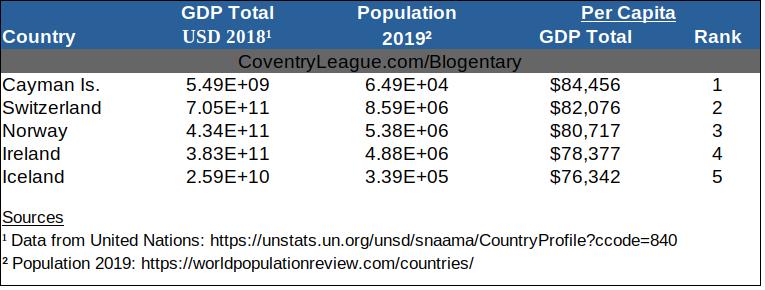
When we thought of some places that might have a GDP per capita meaningfully greater than the U.S.’s, we thought of these places.
Note, we didn’t analyze and sort the entire database. So, there are probably some other places and countries that might exceed these per capita figures. If so, then leave a comment to this blog post.
These five places make sense to us.
- The first one, the Cayman Islands, is where insurance companies, hedge funds, and many other financial-related organizations prefer to domicile.
- Switzerland probably used to be number one prior to the U.S. making rules about banking privacy for its citizens. In addition to high finance, it has precision and quality manufacturing; chemicals & pharmaceuticals; and, coffee, chocolate & cheese.
- Norway is oil & gas rich.2Oil & gas represents 25% of Norway’s GDP.
- Ireland is internationally business friendly, especially regarding taxes and legal structures such as the “Double Irish.” So, a lot of Big Tech and Multinationals set-up subsidiaries in Ireland to “maximize after tax cash flows.” Think Apple, Google (“Double Irish, Dutch Sandwich“), Intel, and many others.
- Iceland has a well-educated, homogeneous, service-oriented,3 Services accounts for ~79% of the economy. and small population (smaller than a typical mid-size city).4Iceland is also the best in the world, “per capita.”
Closing Words
Even though many people state that manufacturing is dead in the U.S., the bubble map and tables that we shared contradict this notion. After all, manufacturing in the U.S. is ranked #2 in the world.
Wow. Thank you for the Infographic about GDP Manufacturing worldwide. The tables are really informative. I read some of the links related to the top five countries per capita GDP. Ireland is dependent on firms in the United States , particularly Apple:
“Ireland’s Corporate Tax System is a central component of Ireland’s economy. In 2016–17, foreign firms paid 80% of Irish corporate tax, employed 25% of the Irish labour force (paid 50% of Irish salary tax), and created 57% of Irish OECD non-farm value-add. U.S.–controlled firms represent almost all foreign firms in Ireland and in 2017 were 25 of the top 50 Irish firms, and 70% of the revenue of the top 50 Irish firms (§ Low tax economy). By 2018, Ireland had received the most U.S. § Corporate tax inversions in history, and Apple was over one–fifth of Irish GDP. Academics rank Ireland as the largest tax haven; larger than the Caribbean tax haven system.”
From the wikipedia link, “Corporate Tax in the Republic of Ireland”.