SecondMarket provides a
timeline of trades in Facebook (FB)’s common stock since April 2008. If one applies a discount (let’s use 30% for example purposes) to account for a limited supply of shares available via SecondMarket versus a larger supply of shares otherwise available in a publicly traded market, then one could derive a “fair” value of FB in a public market (note 1).
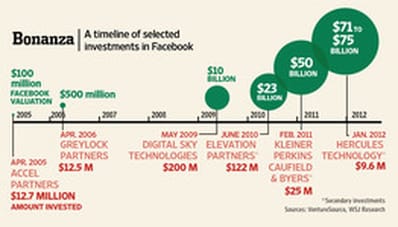
Further, SecondMarket data from 2012 along with a January 2012 tiny venture capital round (only $9.6 million at about $31 per share) seem to have been used and publicized to anchor in a price and valuation to justify the targeted IPO price range. Accordingly, it would be reasonable to consider this data as less reliable and an outlier.
So, using data from the last half or last quarter of 2011 would provide a reasonable benchmark share price in which to apply a discount (or a discount range). A back-of-the-envelope calculation indicates a share price on SecondMarket that averaged about $32. Applying a conservative 30% discount indicates a “fair” share price of roughly $22 if supply were not as constrained as it was on SecondMarket. Given this assessment, the investment bankers apparently earned their commission since they priced the IPO at a 72% premium to the adjusted share price calculated using SecondMarket data.
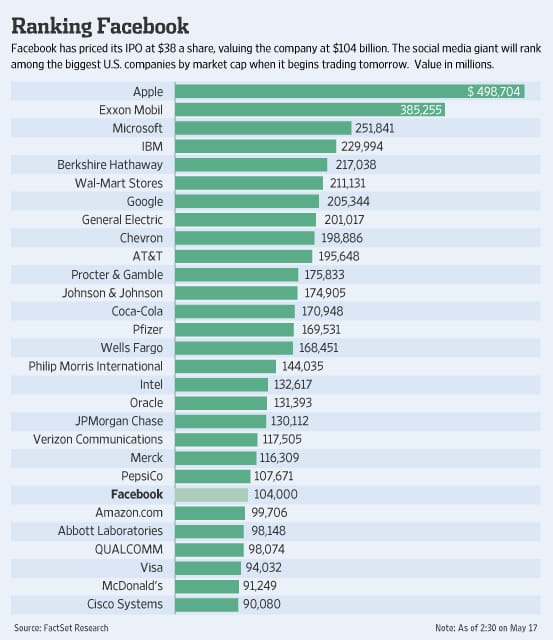
Our opinion is even at $22 per share, which implies a market capitalization of $60 billion (note 2), FB is considerably “overvalued,” especially in light of the most highly valued companies depicted in the chart below and highlighted on InvestmentNews by Mark Bruno.
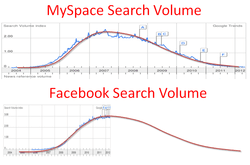
Regardless, to incorporate a downside valuation range, one might want to further consider the picture highlighted in the upper left above from a ZeroHedge blog title “
PeakBook?” that compares search volume between Facebook and Myspace. Or, read a post at Forbes by Mark Evans titled “
Warning: Stay Away From The Facebook IPO.”
———————————————————
(1) Securities and Exchange Commission. 424(b)(4) Prospectus filing dated 17 May 2012. . Total Class A and Class B shares being offered in the IPO is 421,233,615 or about 20% of actual common shares outstanding as of 31 March 2012 of 2,138,085,037 and 15% of adjusted common shares outstanding after the IPO of 2,741,527,754.
(2) Total Class A and Class B common stock to be outstanding after initial public offering: 2,741,527,754 multiplied by the calculated common stock price per share of $22.


Facebook IPO had started with a big boom but later share brokers and investors found it very low competitor and prices goes down.
Good points. I notice your link relates to buying Facebook ‘likes,’ which has been a recent active topic related to FB.