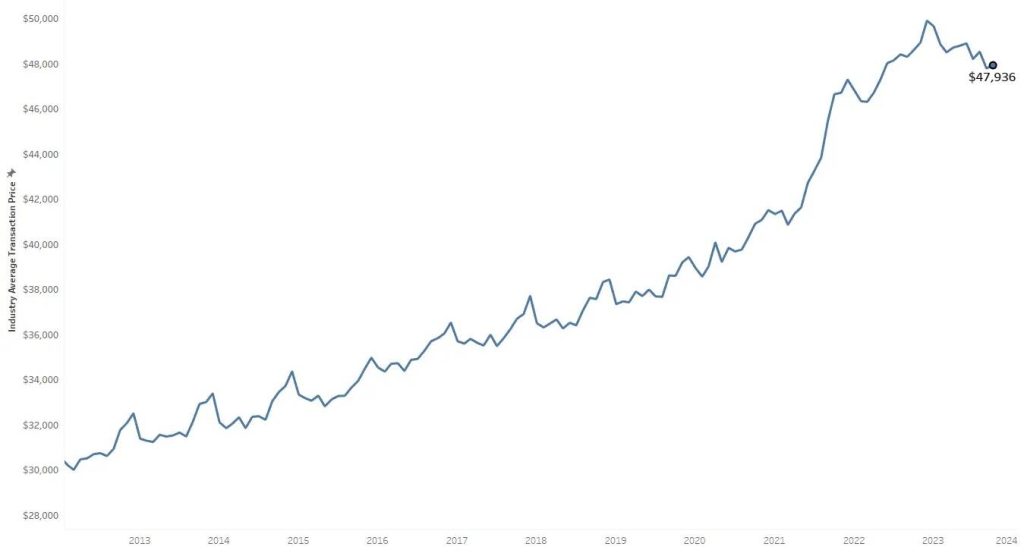
We came across a chart (see below) by Cox Automotive that shows the industry average transaction price for a new car has increased from about $30,000 in October 2012 to $49,000 in October 2023. In other words, in eleven (11) years, the growth of new car prices has increased 1.6x or 4.6% per year (compounded annually).
So, how does the growth of new car prices compare to the growth of the FED’s balance sheet?
Table of Contents
New Car Prices
Here is the chart by Cox Automotive of new car prices from 2012 to October 2023 using average transaction prices (ATP):

We also read a related article on ZeroHedge that included an infographic by VisualCapitalist. The author of that article, presumably one of the Tylers at ZH, said this about the growth of new car prices:
A host of factors can explain the jump in new car prices.
Presumably a Tyler Durden at ZeroHedge
To which Rusticus, the top commenter on that article at the time of our reading it, wrote, quite poignantly:
The author omits the primary reason; if you take that chart of the rise in new car prices and compare it to a chart of the Fed’s balance sheet, they’re in lockstep.
One can do the same for housing, food, insurance, etc. … cheap money has made everything else expensive.
Rusticus (commenter at ZeroHedge)

FED’s Balance Sheet
As such, the comment by Rusticus piqued our curiosity.
Essentially, if our nation had a stable form of currency to use for trasactions, then we would experience price decreases in many goods and services that benefit from technological advancements and productivity improvements. With respect to cars, computers, phones, housing, food, taxes, education, medical care/medicine, insurance, and whatnot, we would experience varying degrees of price decreases. In some instances, such as education, there would be huge decreases. This would happen even after considering that modern day products and services might have better quality and better features.1Some will argue that some of those old houses built in the early 20th century using stones, hard wood, and many amenities (wainscots, base boards, railings, French doors) were of better build quality than most average new homes today. Yet, the opposite has happened to the vast majority of these goods and services.2Obviously the prices of most technology gadgets and software have dropped by a lot.
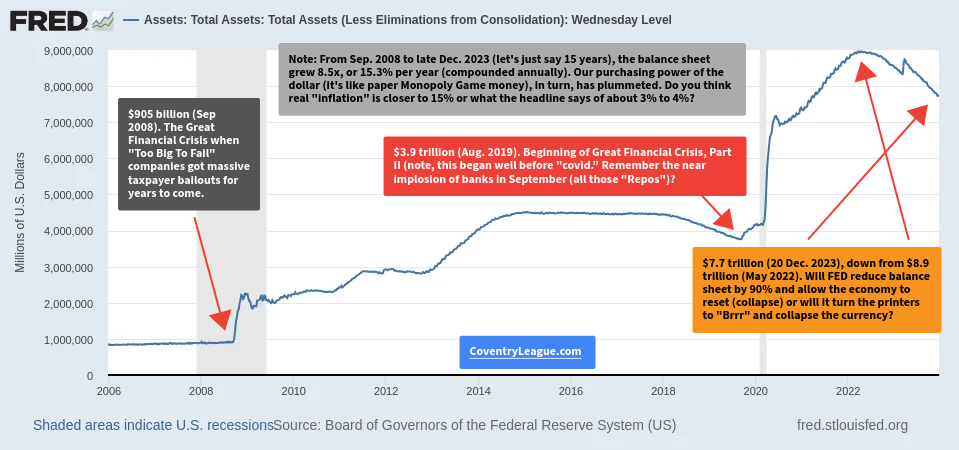
That said, here is one chart that Rusticus might have referenced. It is a chart showing the growth of the FED’s balance sheet since 2006.

Here are our four annotations to the above chart, moving from left to right:
$905 billion (Sep 2008). The Great Financial Crisis when “Too Big To Fail” companies got massive taxpayer bailouts for years to come.
Annotation 1
Note: From Sep. 2008 to Dec. 2023 (let’s just say 15 years), the balance sheet grew 8.5x, or 15.3% per year (compounded annually). Our purchasing power of the dollar (it’s like paper Monopoly Game money), in turn, has plummeted. Do you think real “inflation” is closer to 15% or what the headline says of about 3% to 4%?
Annotation 2
$3.9 trillion (Aug. 2019). Beginning of Great Financial Crisis, Part II (note, this began well before “Covid.” Remember the near implosion of banks in September [2019] (all those “Repos”)?
Annotation 3
$7.7 trillion (20 Dec. 2023), down from $8.9 trillion (May 2022). Will FED reduce balance sheet by 90% and allow the economy to reset (collapse) or will it turn the printers to “Brrr” and collapse the currency?
Annotation 4
Back of Envelope Assessment
Consider this: The FED’s balance sheet has increased at a rate of 15.3% per year since September 2008 and at a rate of about 9.1% per year since October 2012. The latter rate of 9.1% is directly comparable to the 4.6% annual increase of new car prices since the rates were assessed over the same period, from October 2012 to October 2023 (eleven years, roughly).
So, just as Rusticus suggested, we can reasonably conclude that the FED’s (and Treasury’s) creating money from nothing has distorted new car prices (including other items that Rusticus mentioned such as food, insurance, and housing) by making their price in dollar terms more expensive.
Technological Advancements
But, why hasn’t new car prices increased at a rate closer to 9.1% per year since Oct. 2012? Well, there are many reasons including who the recipients have been of this new money. However, we already stated probably the two most important reasons:
- Increased technological advances
- Productivity improvements
These two factors will put downward pressure on end prices, all else equal. As such, it is also fair to conclude that if the FED’s balance sheet remained stable at the level it was in that chart from, say, 2006-2008, then average new car prices would have decreased, more likely than not, since that time.
These two points can be applied to probably 80% of goods and services, meaning if we didn’t have a meddling central bank but instead had a currency entirely backed by gold, silver, and perhaps a mix of other stable physical assets, then citizens would experience real price decreases on the majority of their goods and services.
Front Runners
Lastly, if every person and company received equal opportunity, in proportional amounts and same timing, to the money expansion, then all this doesn’t really matter. But, in the real world, a small number of people and companies (the front runners, for a polite description) get access to the money printing at the margin and then use it to buy assets and services before those assets and services have time to adjust to new, higher prices.
Once the majority of people and companies get access to the increased amount of money (in compensation, business revenues, and financial asset appreciation), their new increased amount of money has to pay for grossly inflated prices. Prices that have increased faster than their share of money supply/expansion.
Think of that game Monopoly. By the rules, the banker can never lose sine the banker can always create and distribute new money.3“The Bank never goes broke. If there are no more banknotes in the Bank, more may be added by writing on paper, using alternative forms of currency, or by simply recording each player’s funds on paper.” It is also easy for the banker to cheat. If the banker in that game decides to give certain players a pile of new money well in advance of the other players, then the front running players will almost always beat the players that received the pile of new money much later.4We know, there are good players that can still outwit players who recieve a massive advantage, but those are exceptions to the rule, as they say. Accordingly, the people and businesses that receive the extra money from the FED’s printing machines much later than do the front runners are at a significant disadvantage, at best. This is how an upwardly mobile society with a big middle class can become distorted with an ever growing poor and lower-middle class population supporting a shrinking upper middle-class and growing wealthy class of society.
Also, the FED and federal income taxation were both created in 1913. But, our currency, the dollar, was still partly backed by gold all the way until 1971, when it was “suspended” from the gold standard. Since then, the US has been in noticeable decline.
In essence, we have just presented one of many variants to the case of why the FED should be abolished, and the sooner the better.
Closing Words
We presented just one example of how the growth of the FED’s balance sheet, which is related to the Treasury, the money supply, and creating money out of nothing, can wreak havoc not only on the price of goods such as new car prices, but also on the affordability of goods and services by people and businesses that are not the early recipients (i.e., front runners) of the newly created money.
As for answering our somewhat rhetorical question in annotation number four, “Will the FED reduce its balance sheet by 90% and allow the economy to reset (collapse) or will it turn the printers to ‘Brrr’ and collapse the currency?” we will just say this:
Businesses and people will be wise to recognize what’s happening and do the best they can to diversify one’s streams of income and physical/financial assets.


[…] Thursday our beloved central bank, the FED, released its new “hypothetical scenarios” for its annual stress test of the largest U.S. banks […]
[…] derived by using a 3.5% annual inflation rate, which is essentially the year-in, year-out loss of the purchasing power of our […]