21 Biggest Tech Acquisitions of 2020

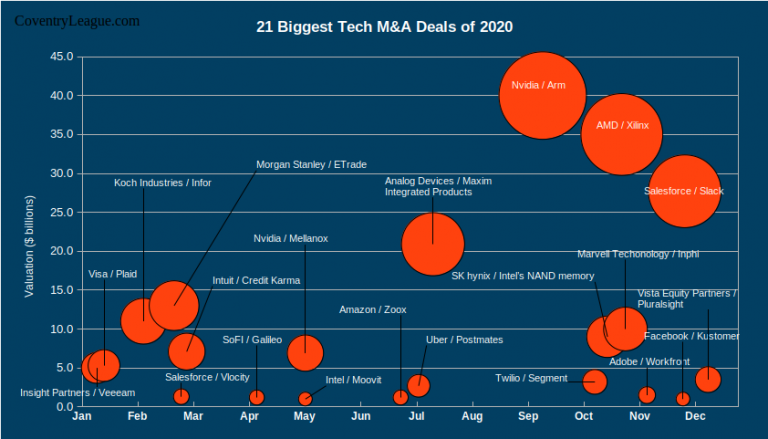
21 Biggest Tech Acquisitions of 2020 displayed in a dynamic table, a bubble chart timeline, and an Infographic.
An M&A and Strategic Finance Advisor
An M&A and Strategic Finance Advisor

21 Biggest Tech Acquisitions of 2020 displayed in a dynamic table, a bubble chart timeline, and an Infographic.

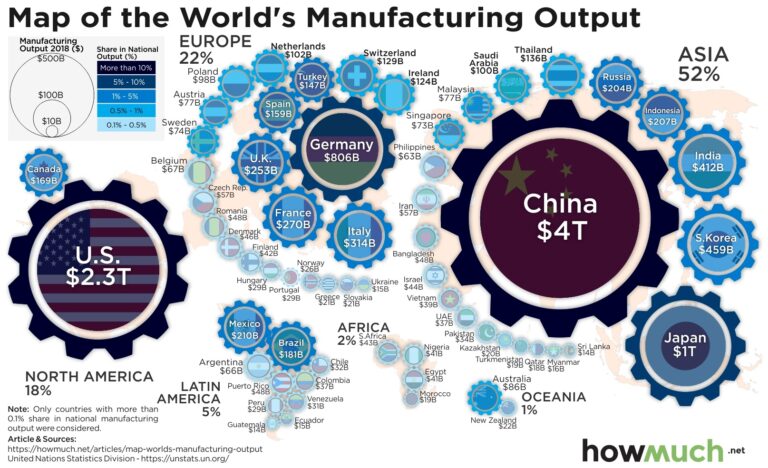
We share a Bubble Map of GDP Manufacturing by Country. We also include tables with per capita data and references to tax havens and structures (e.g., "Double Irish, Dutch Sandwich").

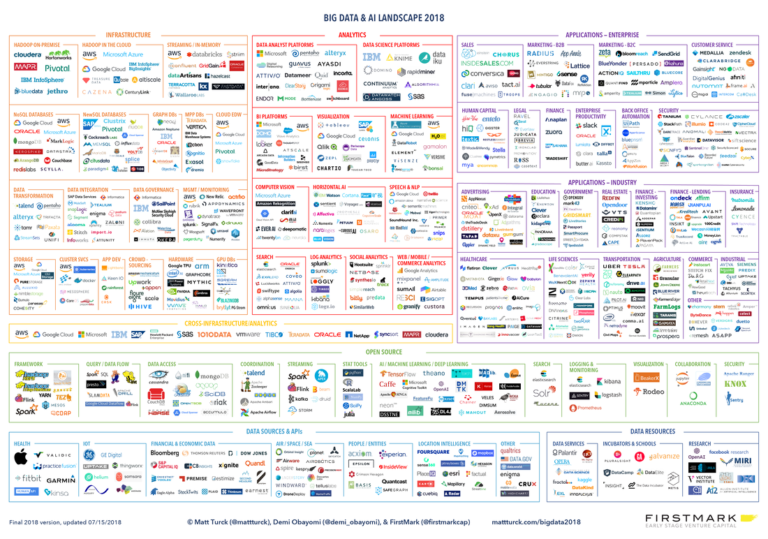
2019 Big Data & Artificial Intelligence (AI) Landscape by Matt Turck and Lisa Xu of FirstMark. Includes commentary and a spreadsheet.

Here is an infographic about the 2018 Landscape of Big Data and Artificial Intelligence by Matt Turck. A spreadsheet is available, too.